
Case Study · Mobile Pet Cremations
From 360 To 1,025 Monthly Bookings — The Full 12-Month Story.
How A Pet Cremation Service Scaled From Local To Multi-County Across Southern California — And Ranked #1 In Google Auction Insights For Over 6 Months.
Service: Google Ads management · Yelp Agency Partner · Industry: Pet services · Region: Southern California · Tenure: 3+ years
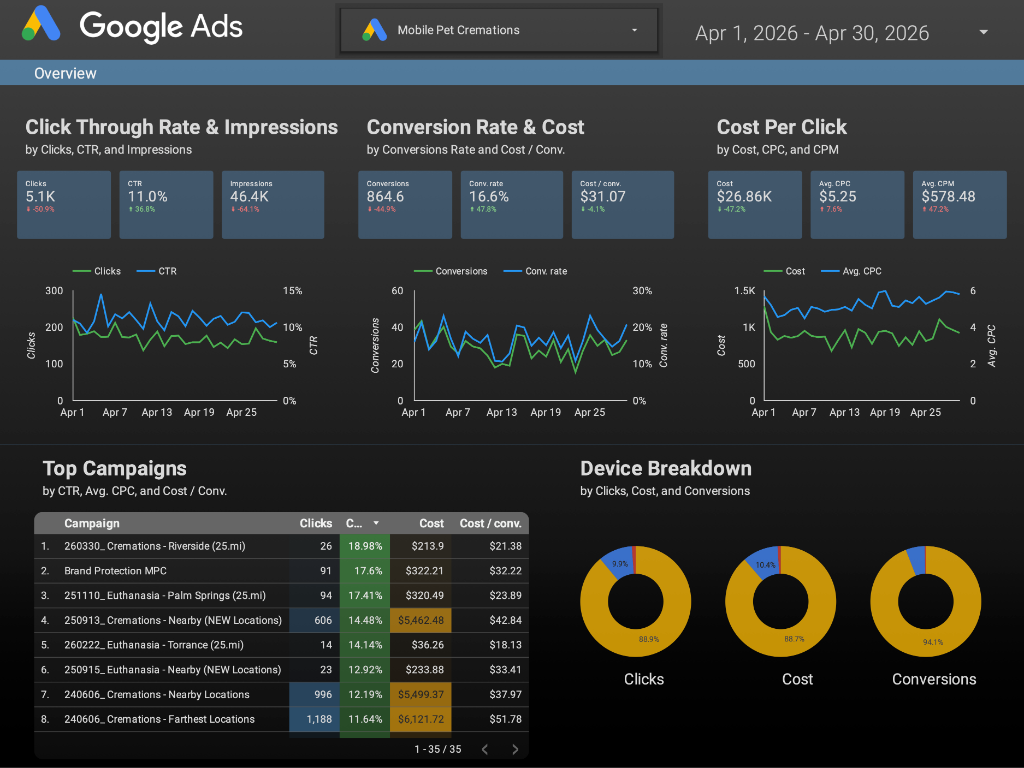
Apr 2025 – Apr 2026 · 6,500+ total bookings delivered · $250K+ ad spend managed
Before
How They Found Us — And What Wasn't Working.
Mobile Pet Cremations didn't come in cold. Peripheral Media had already been managing their Yelp campaigns as a Yelp Agency Partner — over $45,000 in Yelp ad spend across three quarters, with results good enough that they kept renewing.
They came to us with a different problem: their Google Ads.
They were running Google Ads themselves. Self-taught from YouTube tutorials. They knew the platform existed, knew it could work, knew they were spending money on it — but had no clear way to measure success or know whether the structure they'd built was right. The campaigns were live. The results were inconsistent. The optimization decisions were guesses.
That's a familiar pattern. Service businesses end up running their own Google Ads not because they want to, but because no one's offered them a credible alternative. The owner watches a few tutorials, sets up campaigns that seem to make sense, and hopes the math works out. Sometimes it does. More often, it works in fits and starts — a good month, then a bad one, with no clear understanding of why either happened.
When they handed us the account, we ran a few months of careful work — restructuring, measuring, optimizing — to see what was salvageable and what needed rebuilding from scratch. The rest is history.
The Work
What Actually Drove The Growth.
There's no single trick. The growth from 360 monthly bookings to 1,025 was the result of compounding work across five distinct areas — and the willingness to fluctuate budget aggressively to learn what worked.
The first thing we restructured was the campaign architecture itself. The DIY structure had everything mixed together — search, display, branded — into one or two catch-all campaigns. We separated by campaign type and intent, which gave us the ability to optimize each one based on its actual performance instead of treating averages.
Audience targeting got rebuilt from the ground up. The original campaigns targeted broadly — anyone searching pet-related terms in the service area. We narrowed it. People searching for emergency or end-of-life pet services have a specific intent profile. Their searches happen at specific times of day. They behave differently than browsers or planners. Targeting that intent specifically — and excluding the broader pet audience — made every dollar work harder.
Keyword research went deep. Not 'what do people search for' but 'what do people search for in the worst hour of their lives.' Different language. Different structure. Different urgency. We built keyword groupings around those moments and matched ad copy to the emotional context.
The website and landing pages got optimized in parallel. Google Ads can only do so much when the destination it's sending traffic to doesn't convert. We worked on page speed, mobile experience, form clarity, phone number prominence, and trust signals. Every improvement on the landing page raised the conversion rate, which lowered cost per booking, which let us scale spend further.
And we expanded the campaign mix. The DIY setup was Search-only. We added Display, YouTube, and Performance Max — each one tested, measured, and either kept or cut based on whether it produced bookings. PMax in particular took several rounds of refinement before it earned its place in the mix.
Through all of this, the budget fluctuated. Some months we tested aggressively, scaling spend up to learn what the ceiling looked like. Other months we pulled back to consolidate around what was working. That fluctuation wasn't a sign of indecision — it was a sign that we were actively learning. A static budget is a budget that's stopped optimizing.
01
Campaign Restructure
Separated search, display, branded, and PMax into distinct campaigns — each optimized independently.
02
Audience Optimization
Narrowed targeting from broad pet audiences to high-intent emergency searchers. Excluded the rest.
03
Deep Keyword Research
Built keyword groups around emotional context and urgency — not just product terms.
04
Landing Page Optimization
Speed, mobile UX, form clarity, trust signals. The destination matters as much as the ad.
05
Channel Expansion
Layered Display, YouTube, and Performance Max — tested, measured, kept or cut on real data.
The Numbers
12 Months. 14 Reports. Everything On The Table.
The Results page shows the headline numbers. This page shows the full data — every quarter, the trajectory, the variance, and what compounded.
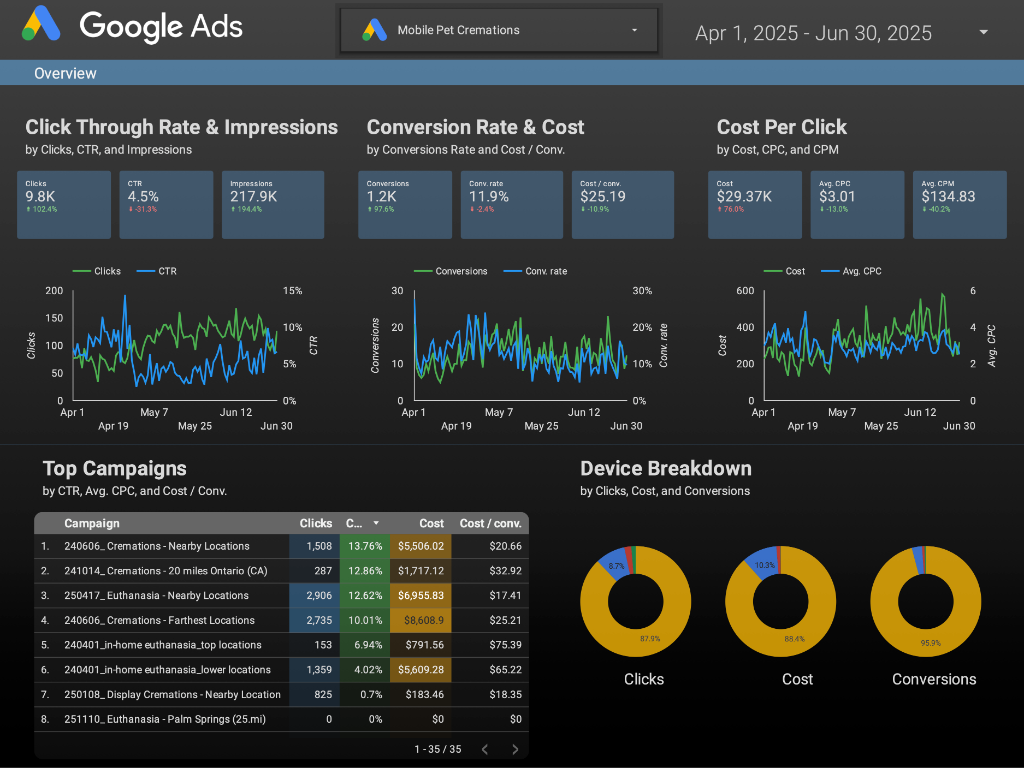
Q2 2025 (Apr–Jun) · 1,138 conversions · $26K spend · The starting point. Conversions per month: 360 → 389. Cost per conversion stabilizing around $20–30.
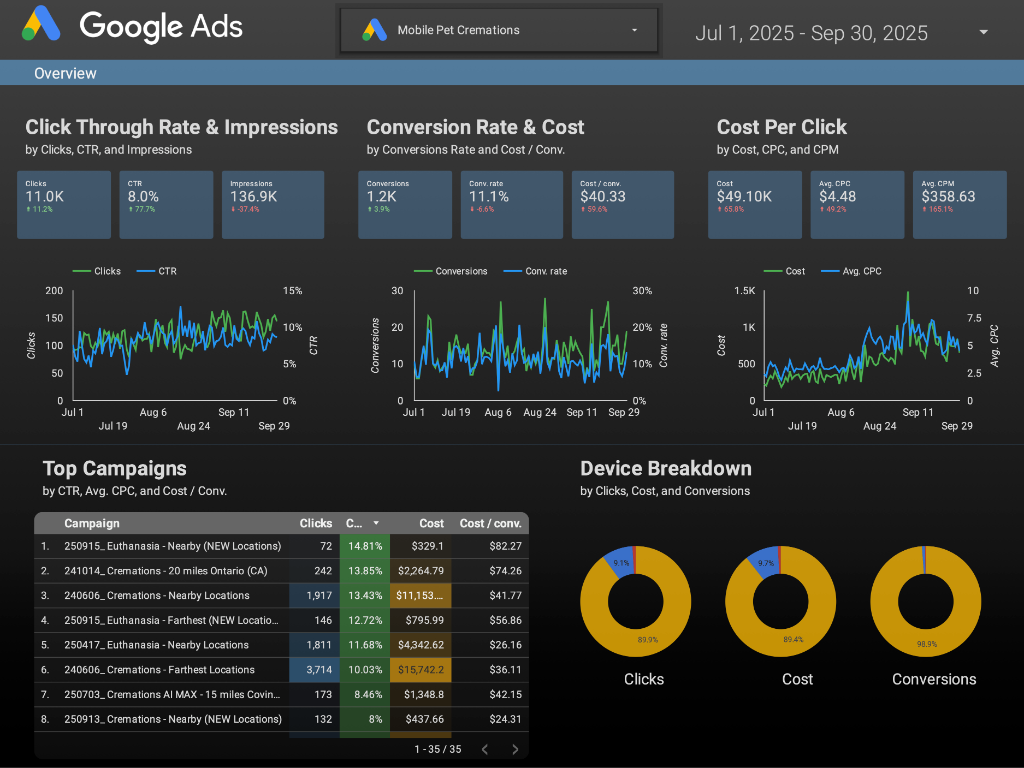
Q3 2025 (Jul–Sep) · 1,203 conversions · $49K spend · The scale-up period. Bing Ads layered as a low-cost secondary channel. September spend pushed to $25K to test ceiling — September was learning, not optimization.
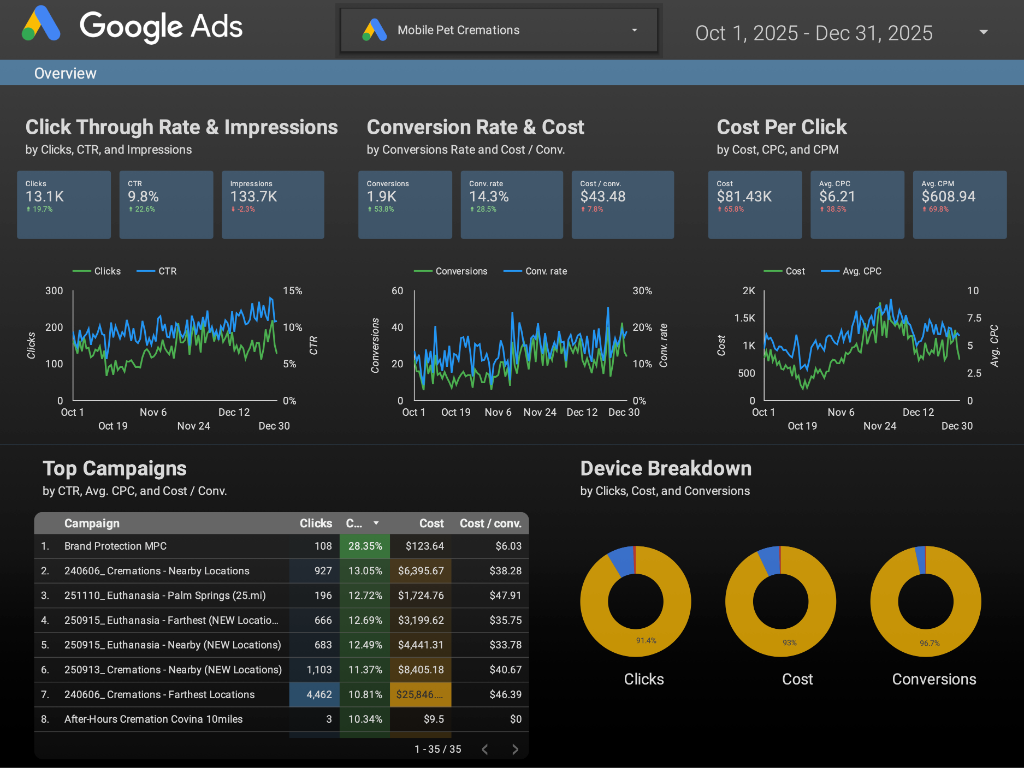
Q4 2025 (Oct–Dec) · 2,035 conversions · $81K spend · The breakthrough. Conversions per month broke through 700 in November and 800 in December. Cost per conversion held in the $35–43 range while volume nearly doubled.
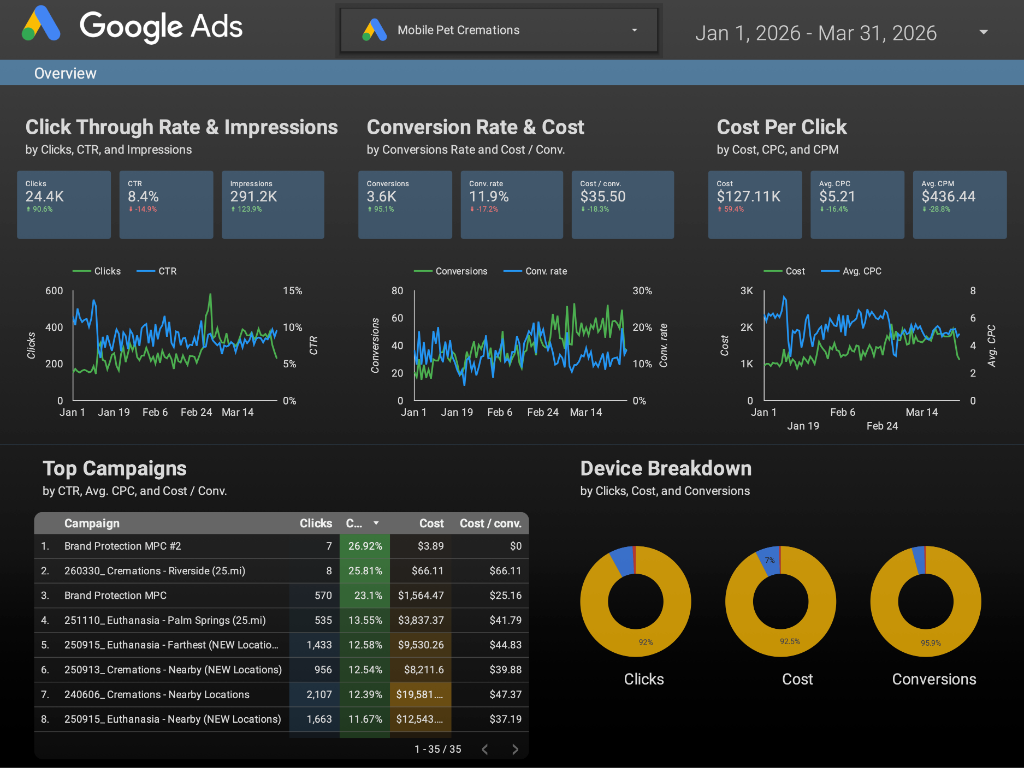
Q1 2026 (Jan–Mar) · 2,000+ conversions · $110K+ spend · The record. February 2026: 1,025 conversions in a single month. Phone calls peaked at 743. Cost per booking held at $39, even at peak volume.
| Period | Conversions | Spend | Cost/Conv | Phone Calls |
|---|---|---|---|---|
| Q2 2025 | 1,138 | $25,883 | $22.74 | 681 |
| Q3 2025 | 1,203 | $49,102 | $40.81 | 1,196 |
| Q4 2025 | 2,035 | $81,429 | $40.01 | 1,645 |
| Q1 2026 | 2,182 | $110,748 | $50.75 | 1,591 |
| Apr 2026 | 863 | $26,860 | $31.11 | 558 |
| TOTAL | 7,421 | $294,022 | $39.62 avg | 5,671 |
Across 13 months: 7,421 conversions delivered, 5,671 phone calls generated, $294,022 in ad spend managed. Cost per booking averaged $39.62 across the full period.
Current State
Four Counties. Two Services. #1 In Google Auction Insights.
The current Mobile Pet Cremations campaigns cover four counties across Southern California — territory that's tens of thousands of square miles and millions of pet-owning households.
We're managing campaigns across:
- Orange County
- Parts of Los Angeles County
- Riverside County
- San Bernardino County
Two distinct services, geo-targeted by county, with separate budgets and creative tailored to each market's intent profile. The Auction Insights report — Google's own measurement of where you stack against competitors in the same auctions — has shown Mobile Pet Cremations ranked #1 for more than six consecutive months.
Auction Insights #1 is a meaningful signal. It means that across thousands of impressions in a competitive market, your ads are being shown more frequently and in better positions than every other business bidding on the same searches. That's not something you buy with budget alone — Google rewards relevance, quality score, and conversion history. Six months of #1 rankings means the entire campaign infrastructure is working in concert.
#1
In Google Auction Insights
6+ consecutive months across primary service campaigns
4
Counties covered
3+
Years working together
1,025
Best single month (Feb 2026)
What This Shows
Real Growth Comes From Compounding Work — Not One Magic Move.
There's no single thing in this case study that explains the 3x growth. There never is.
What there is: campaign restructure, audience refinement, deep keyword work, landing page optimization, channel diversification, and the willingness to fluctuate budget aggressively while learning what works. Five or six different optimizations, each compounding on the others, each given enough time to prove or disprove itself.
The accounts that struggle most are the ones looking for the one trick. The accounts that win are the ones willing to do the boring work — month after month, quarter after quarter, with someone watching the dashboards every day.
That's what 3+ years of partnership looks like.
Want This Kind Of Trajectory For Your Account?
If your Google Ads account is running but not compounding — let's talk.
See If We're A Good Fit →Read other case studies: